Whether you run a whale-watching charter in Vancouver, a Jeep tour in Sedona, or a history walk in Charleston, your "Customer Lifetime Value" (CLV) calculation is probably broken.
Read MoreFotaflo Blog
Every great adventure needs someone to maintain the journey’s flow.


If you’re staring at your 2026 dashboard and obsessing over "cost-per-click," you’re missing the ghost in the machine.
Read More
As an outdoor adventure operator, your daily to-do list reads like a survival manual. You are checking tire pressures on the 4x4s, squinting at Doppler radar, troubleshooting a spotty Wi-Fi signal in the basecamp, and ensuring that the safety harnesses are as reliable as the sunrise.
Read More
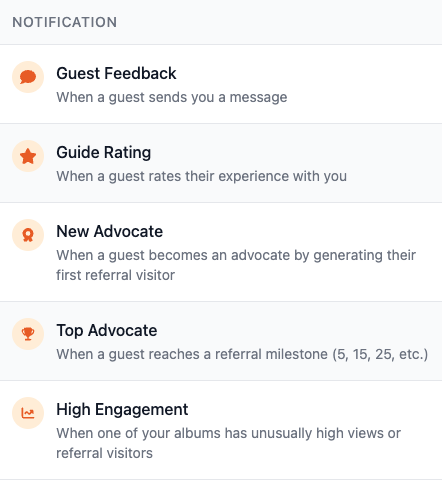
Introducing Fotaflo Notifications
Introducing Notifications: Stay Connected to Every Moment That Matters
Never miss a guest purchase, rating, or referral again. Notifications bring real-time updates to Fotaflo - your way.
Read More
Beyond the Keyword: How Your Guest Photos Become AI-Ready Assets
In our recent look at Performance & Visibility, we touched on the technical "under the hood" changes to the Fotaflo platform. But for the modern tour operator, these aren't just speed upgrades—they are a fundamental shift in how your business is discovered in an AI-driven world.
Read More
Feature Focus: Audience-Specific Content
Stop Marketing to Strangers—Start Converting the "Inner Circle"
Read More
Stop Buying Ads, Start Scaling Advocates: Why Your Guest Photos are Your Strongest Asset in a Tight Economy
In the current macroeconomic climate, tour and activity operators are facing a "perfect storm." Inflation is squeezing margins, advertising costs on traditional platforms are skyrocketing, and the modern traveler is more selective than ever.
Read More
You know that feeling when the whole industry finally catches up to the thing you've been shouting from the rooftops for years? Yeah, that's us right now.
Read More
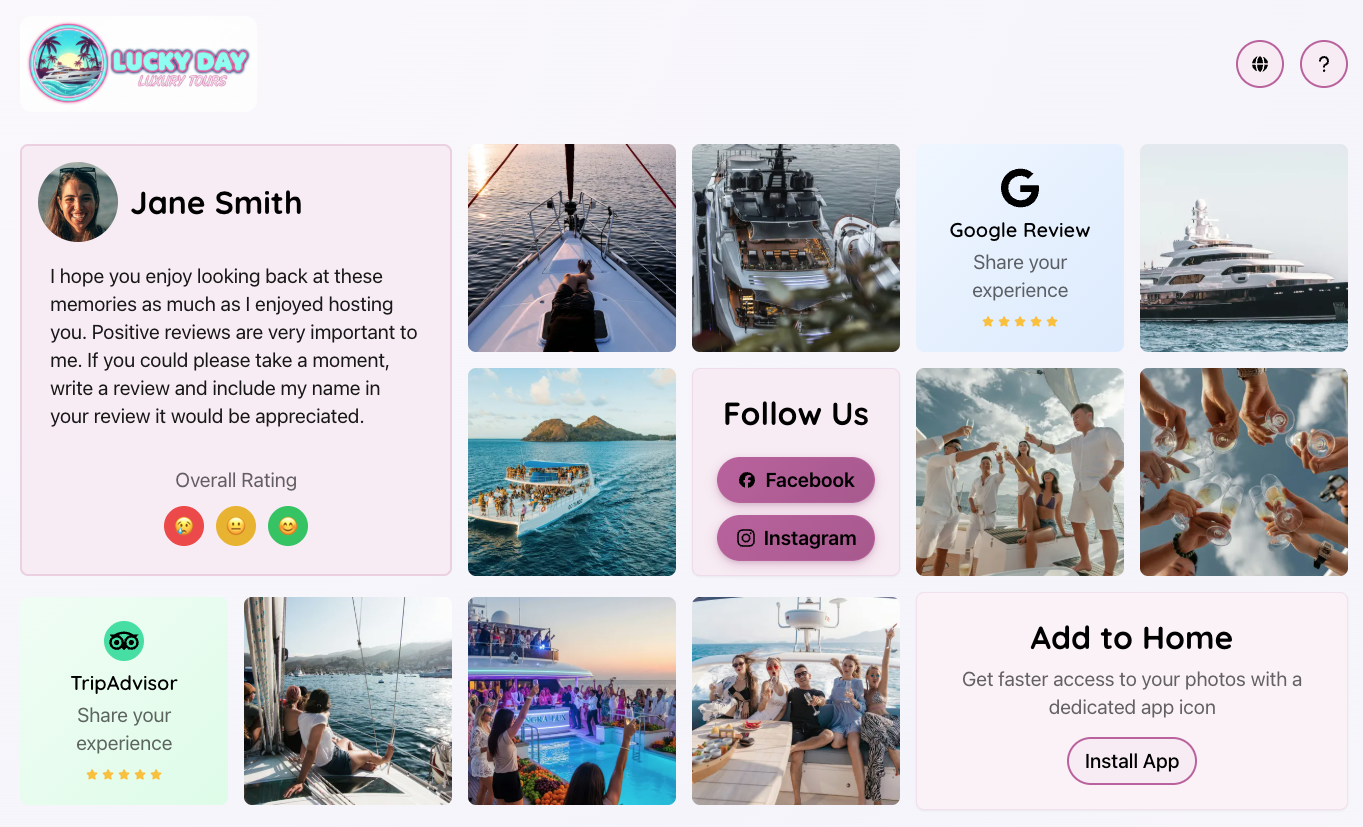
The Real ROI of Memories: Why One Guest Photo Share is Worth 16% More Than an Ad Click
For every tour operator and activity operator facing rising Customer Acquisition Costs (CAC), the same question comes up: Where can I find affordable, high-quality, and trustworthy leads?
Read More
The Power of Pictures: How Fotaflo Drove a 127% Spike in Word-of-Mouth Referrals for Kohala Zipline
“For over a decade, Fotaflo has been a powerful, marketing-focused product, not just a photo sales solution. It uses photos to increase customer reach through social sharing and referrals, directly driving demand for our business.
It is a crucial, versatile tool that differentiates us from competitors, enabling new applications like sharing deep-space photos on our Mauna Kea tour.
Fotaflo's team stands out for its customer focus, treating clients like family. Like FareHarbor, they continuously grow and evolve, never resting on past achievements, and always adding requested features. Their commitment to innovation is exceptional.”
-Jason Cohn, President of Hawaii Horse and Trail and Kohala Zipline
Read MorePopular Posts
Subscribe to receive industry updates and the best advice on memory marketing
Free eBook
Unlock the Power of Memory Marketing. Discover the secrets to attracting more customers and driving repeat business.


